The Dendrogram Tab contains a dendrogram plot with the data points representing different levels of the selected cluster.
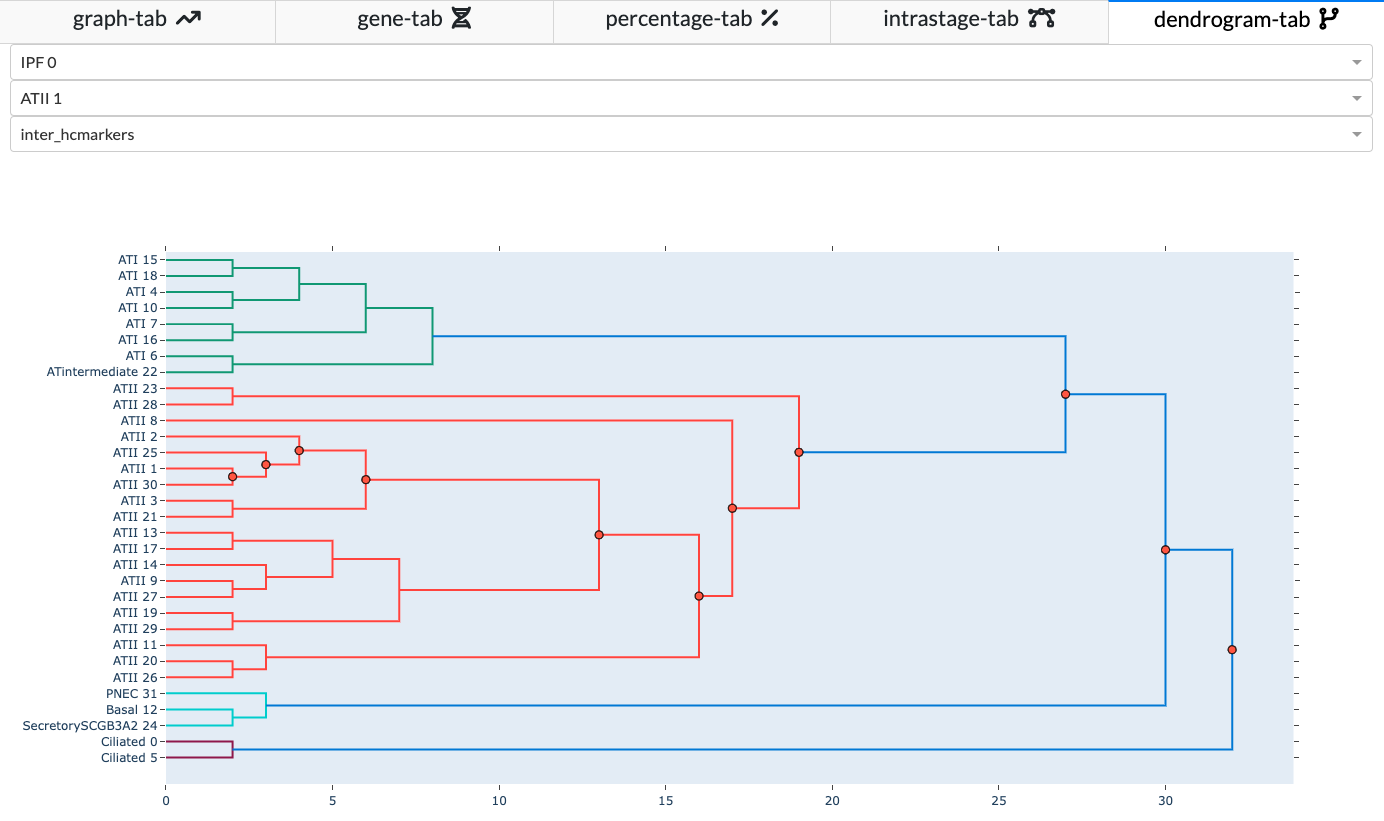
You can click the red data points on the plot to view the table that contains the hcmarkers of the selected cluster at the selected stage comparing to sibling clusters.
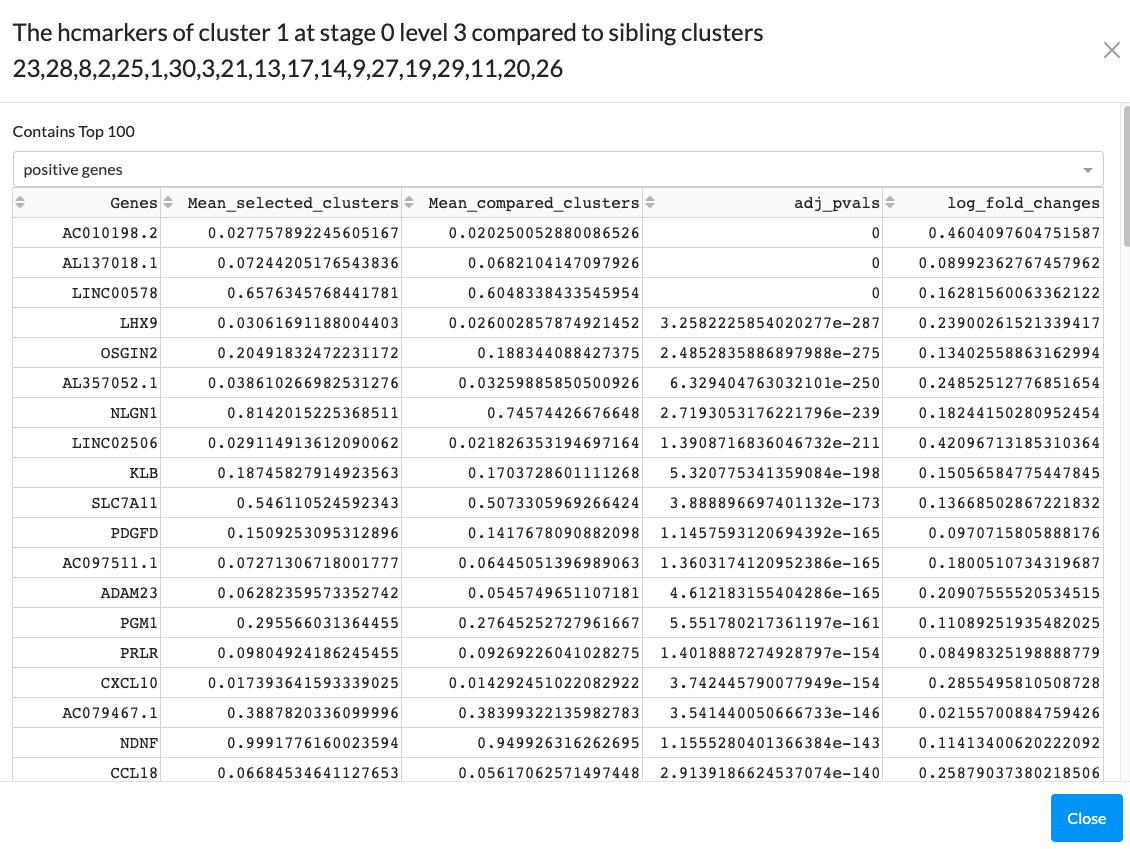
The default table will show the top 100 positive genes. You can use the dropdown menu to change it to top 100 negative genes.