The graph tab contains 2D and 3D lineage plots and an umap section.
A tutorial on navigating the graph tab can be found here.
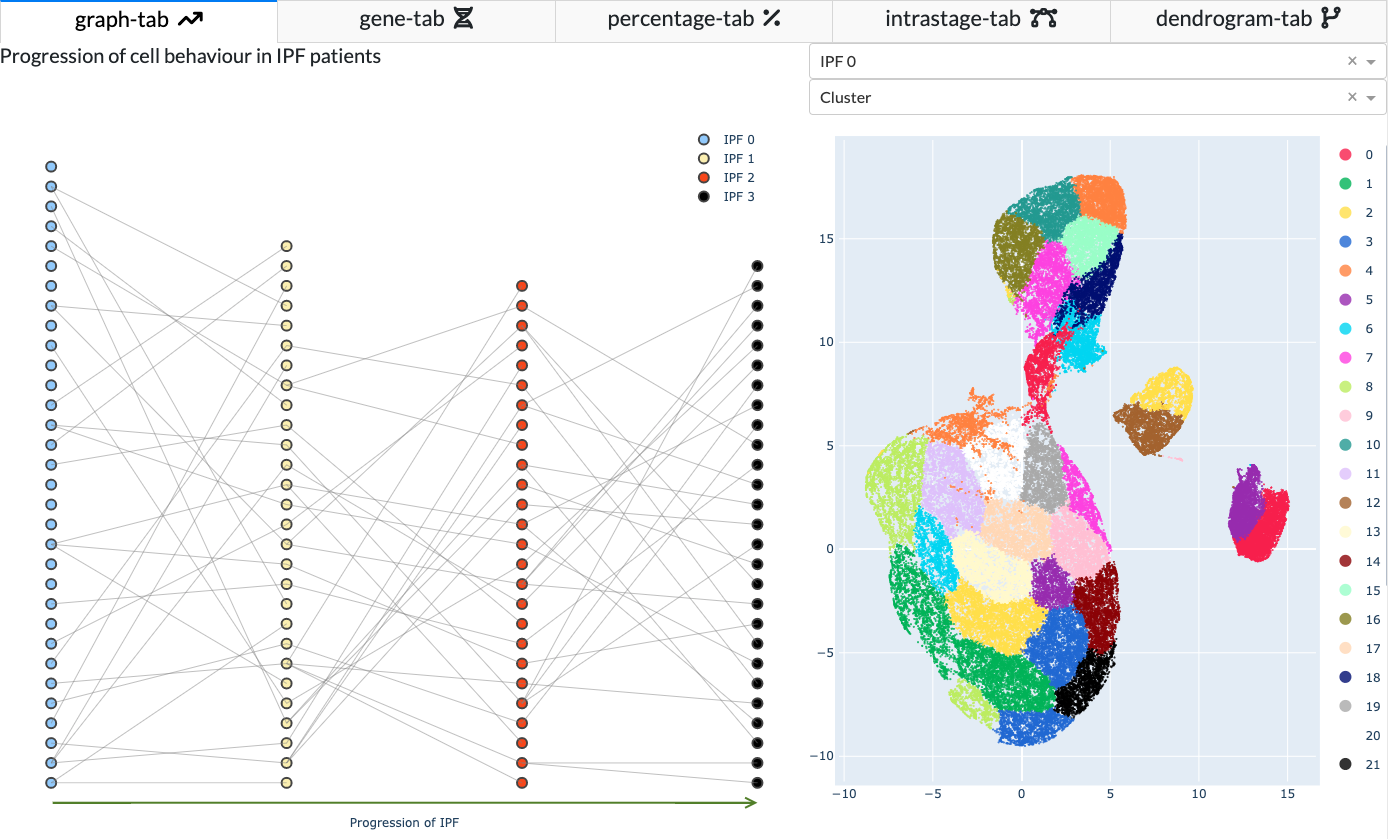
2D Lineage Plot
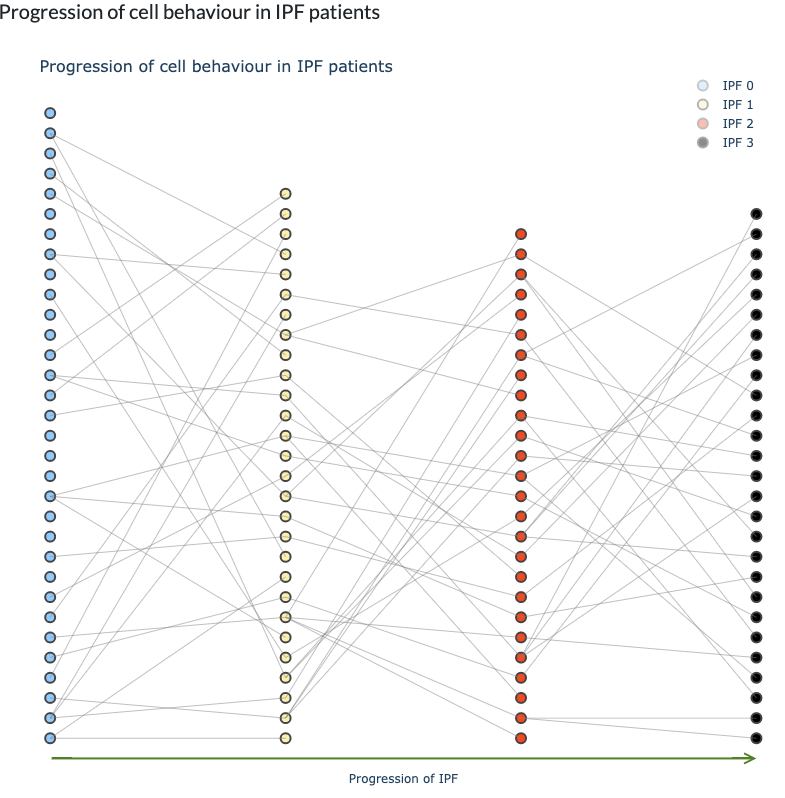
In the lineage plot, each color represents a stage. The leftmost column represents stage 0 and the rightmost column represents stage 3. Each data point is a cluster. The lines connecting to points are tracks. When you hover over a data point, the track(s) in which that cluster belongs to will be highlighted. You can disable this feature by clicking the “Hover Track” button in the path selection panel.
When the display mode is DEG, clicking the data point will show a table containing the gene expression of top-genes in that cluster.
When the display mode is iDREM, clicking the data point will direct you to an iDREM page (if that cluster has a complete track). You can learn more about iDREM in here.
3D Lineage Plot
You can click the “3D” button in the Path Selection panel to view the 3D lineage plot. Click “3D” again to return to the 2D lineage plot.
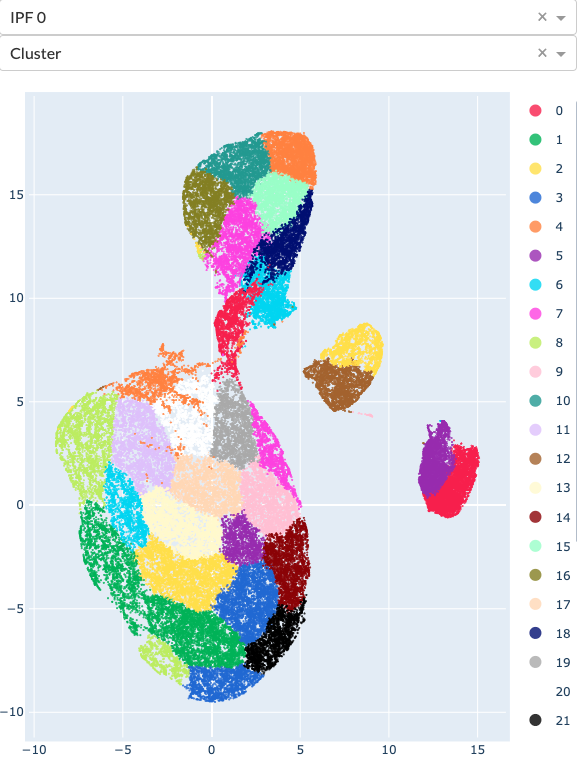
UMAPS of latent cell representation
You can use the dropdown menus above the umap to change the stage and the coloring option. You can also change the display mode to “Highlight on Umap” where clicking a data point in the 2D lineage plot will produce an umap with that cluster being highlighted.