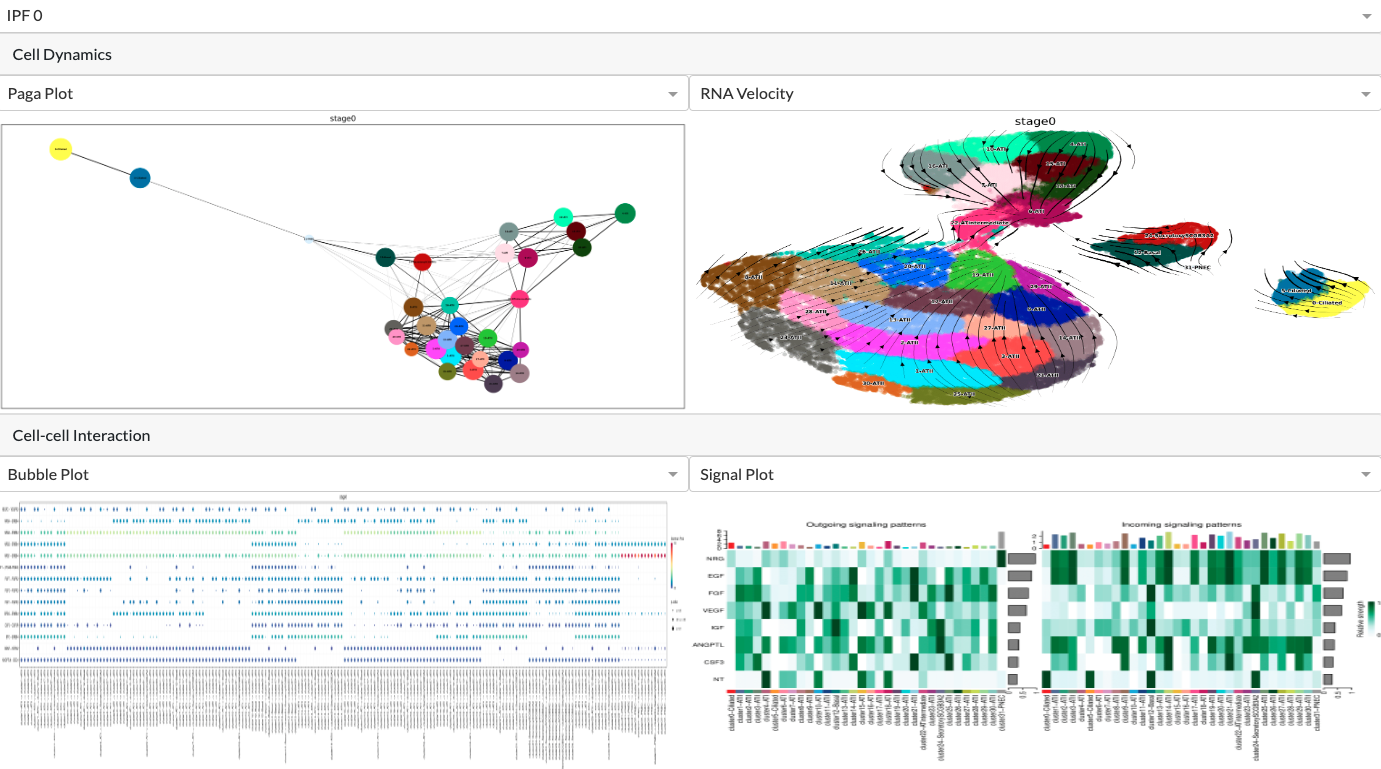
The Intrastage Tab contains two subpanels. The top panel contains plots related to cell dynamics and the bottom panel contains plots related to cell-cell interaction. You can use the dropdown menu to select the plots you want to display. You can also clik the plots to be directed to a new tab where you can download the pdf of the plots.
Cell Dynamics
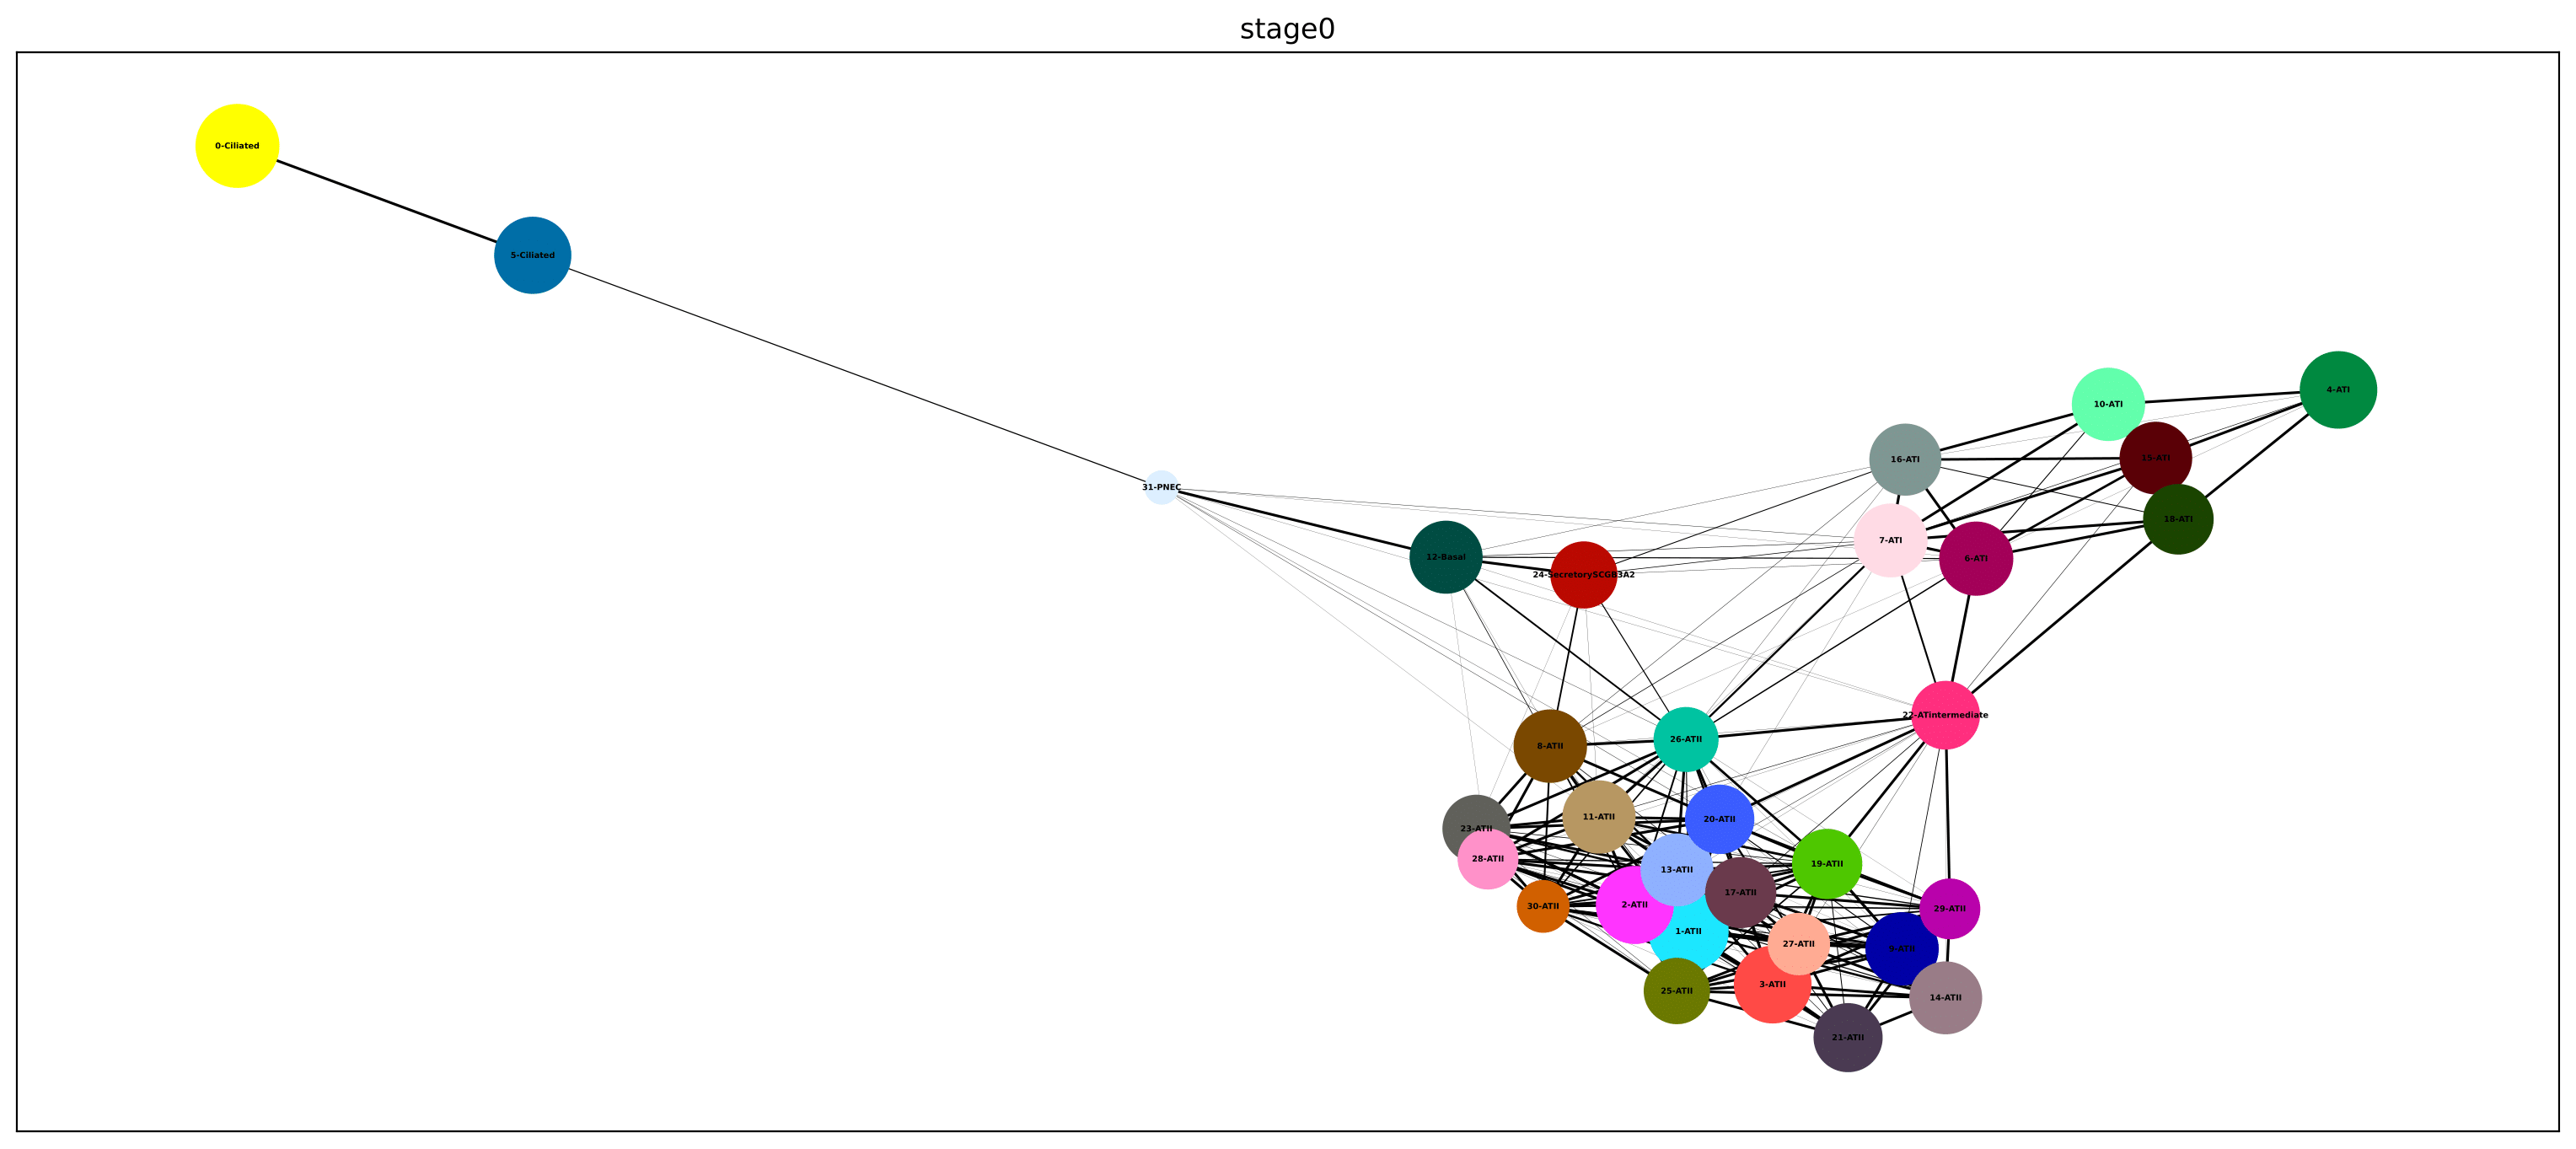
PAGA Plot
Partition-based graph abstraction shows high connectivity between two node via the thickness of the edges. This graph associates a node with each partition and connecting each node via weighted edges that indicate a statistical measure of partition connectivity. This is done by the scanpy package.
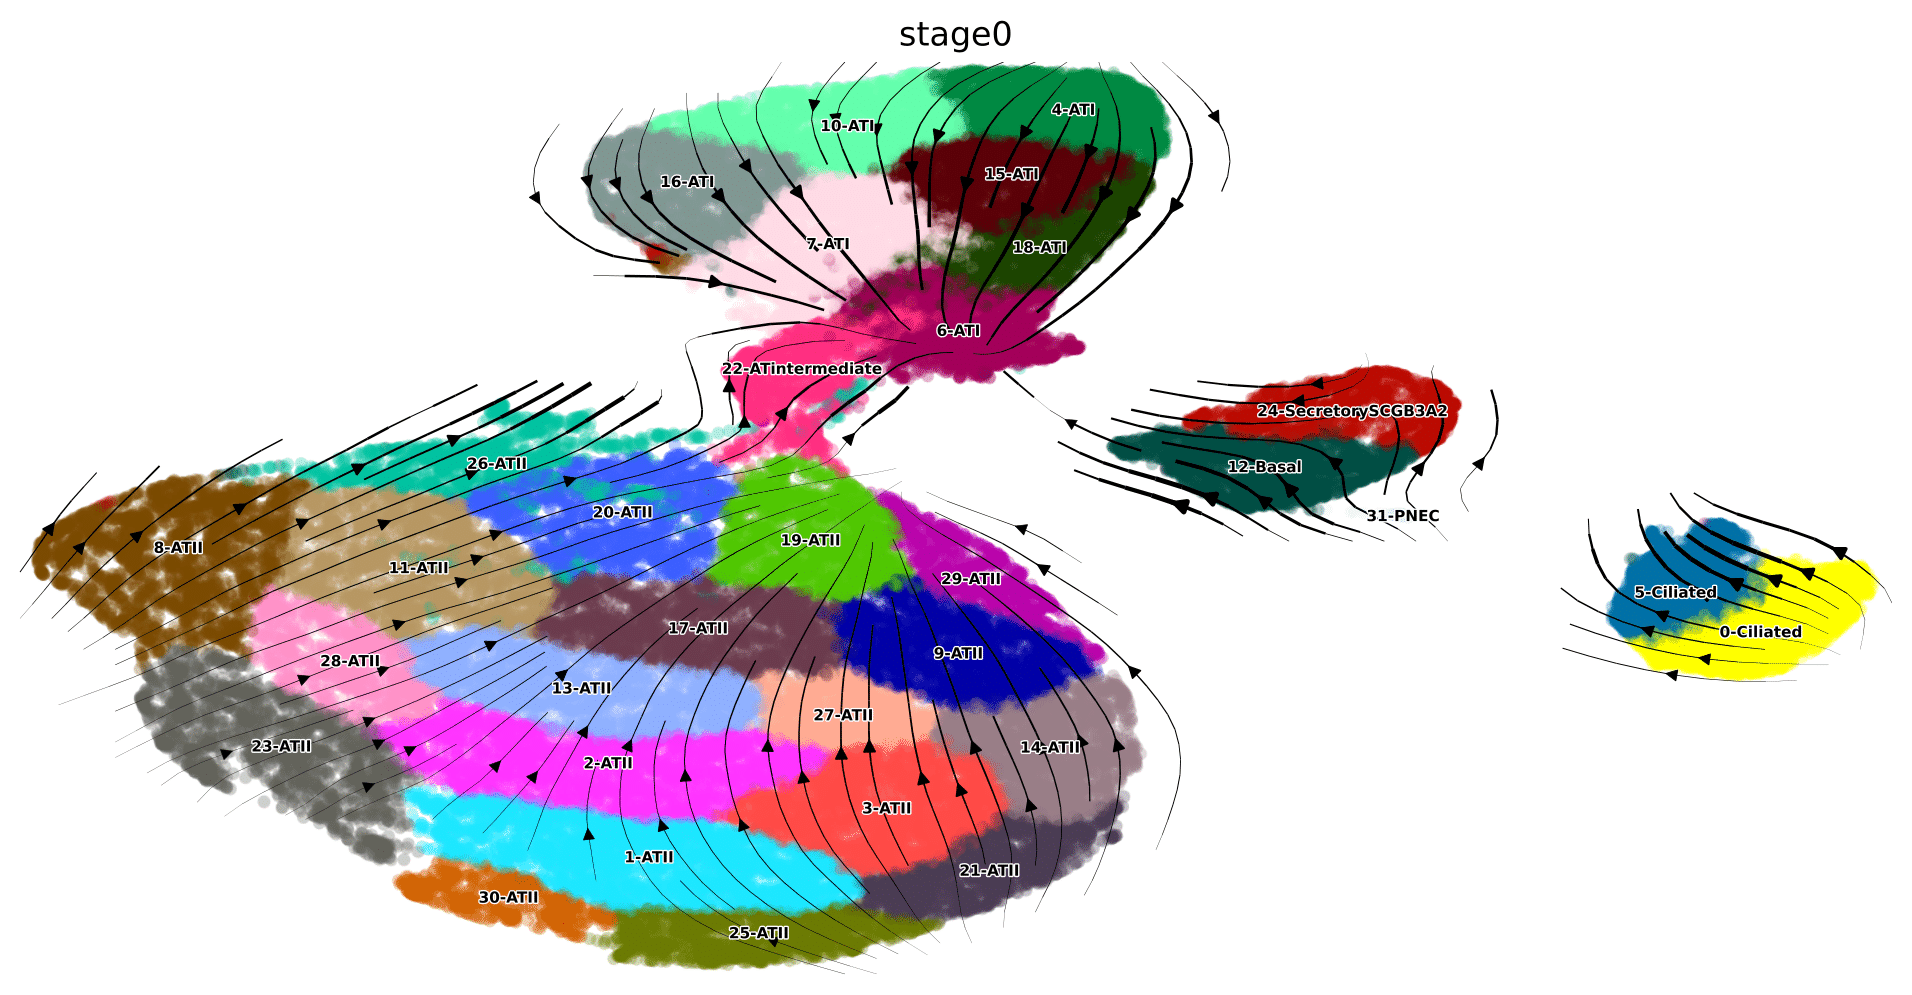
RNA Velocity
The velocity vector field, represented as streamlines, provides fine-grained insight into the developmental processes. The field is project onto the pre-calculated umaps. This is done by the scvelo packages.
Cell-cell Interaction
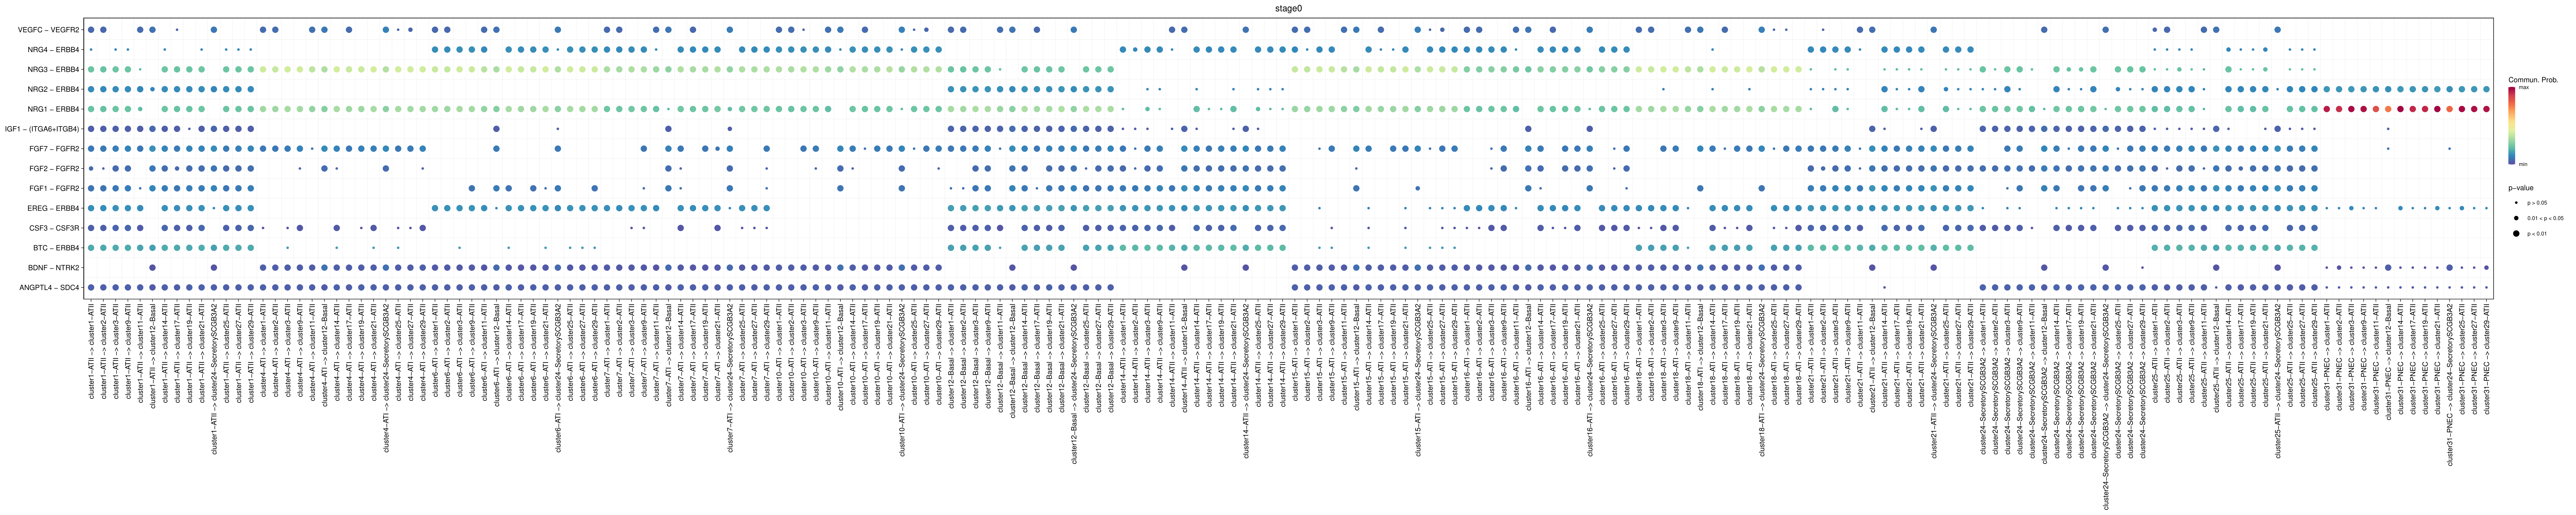
Bubble Plot
We can show all the significant interactions (L-R pairs) from some cell groups to other cell groups using netVisual_bubble in the cellchat packages. The color of the circle indicates communication prob
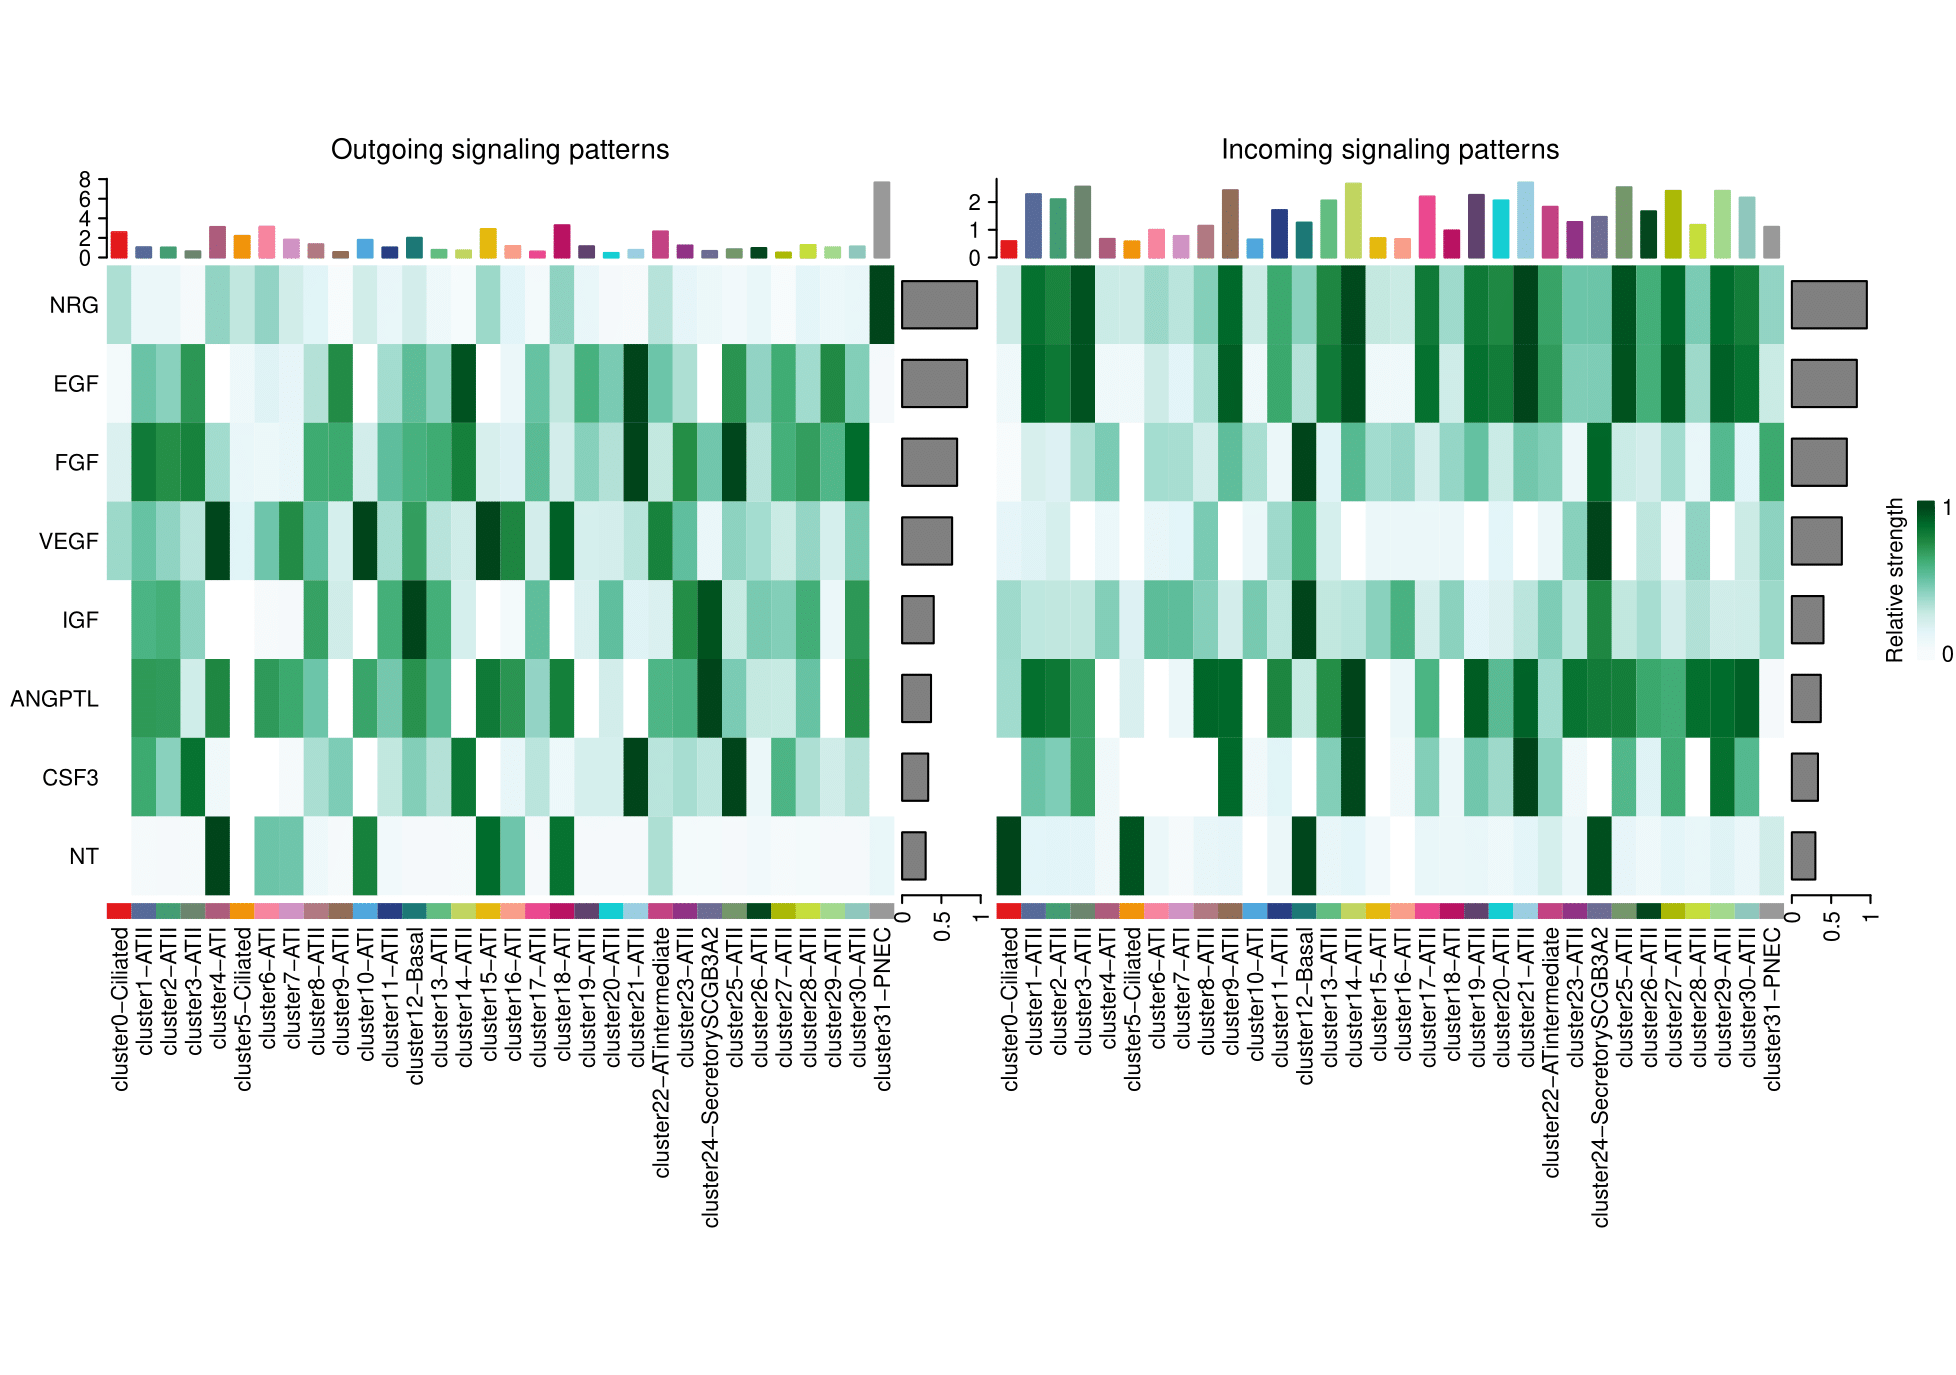
Signal Plot
Identify signals contributing most to outgoing or incoming signaling of certain cell groups. We can also answer the question on which signals contributing most to outgoing or incoming signaling of certain cell groups.