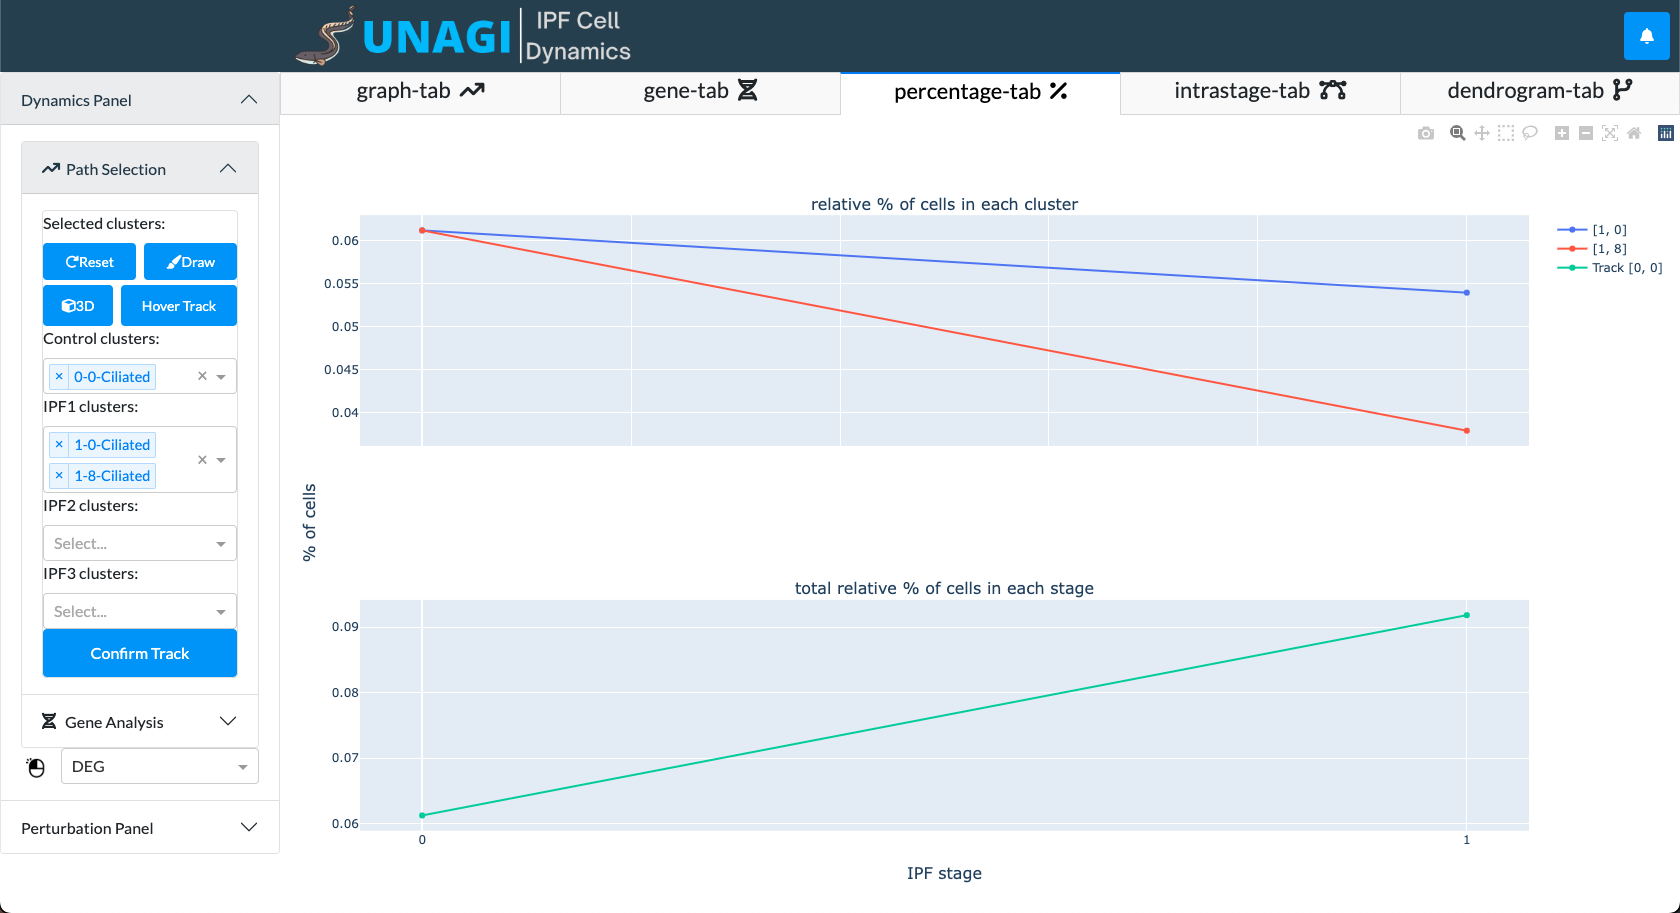
The Percentage Tab contains two plots. The top plot shows the relative percentage of cells in each cluster and the bottom plot shows the total relative percentage of cells in each stage.
To draw the plots, you need to first navigate to the Dynamics Panel in the sidebar on the left. Under Path Selection, select the clusters you want to investigate using the dropdown menus. Once you select a control cluster, the clusters in IPF 1, 2, 3 will be automatically filled in.
After you finish selecting, click ‘Confirm Track’. A notification will be shown on the bottom right notifying that the plots are being drawn.