The dynamics panel contains two sub-panels and a dropdown menu: path selection, gene analysis, and display mode. This panel is used to generate different plots in graph tab, gene tab, and percentage tab. You can find the detailed tutorials on using the panel to generate plots in graph tab and gene tab below:
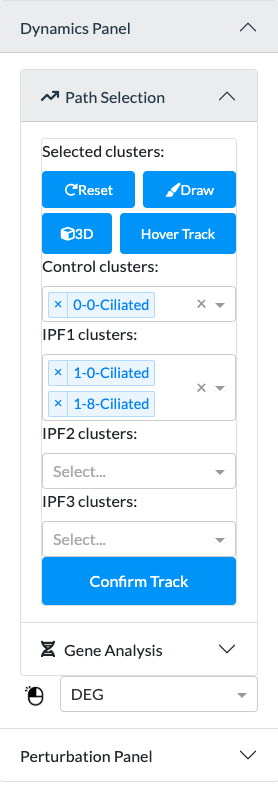
Path Selection
Under Path Selection, you can select the clusters you want to investigate using the dropdown menus. Once you select a control cluster, the clusters in IPF 1, 2, 3 will be automatically filled in.
You can click ‘Confirm Track’ to generate a plot showing the total and relative percentage of cells in percentage tab.
Buttons
Reset
Click to reset your selections.
Draw
Click to highlight the selected clusters in the lineage plot in graph tab.
3D
Click to show the 3D lineage plot. The selected track will be highlighted. Click again to return the 2D lineage plot.
Hover Track
The default is enabled. When you hover over a cluster in the 2D lineage plot, a track will be highlighted. Click again to disable this feature.
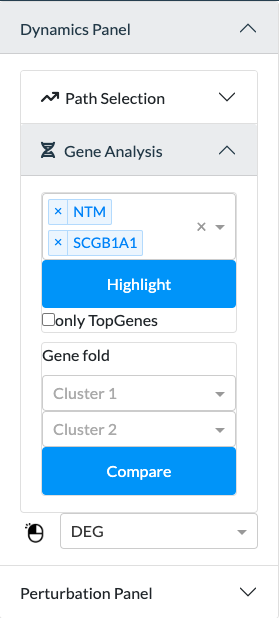
Gene Analysis
You can select the genes you want to investigate. A gene graph, a violin plot, and umap(s) of gene expression will be drawn in the gene tab.
Buttons
Highlight
The clusters in which the selected genes belong to will be highlighted in the 2D lineage plot in the graph tab.
Compare
You can select clusters in the two dropdown menus. Click ‘Compare’ to generate a table comparing the gene expression of the two clusters.
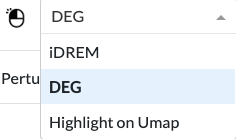
Display Mode
The display mode is for the graph tab. There are three display mode: DEG, iDREM, and Highlight on Umap.
DEG
The default display mode is DEG. Under DEG mode, when you click a cluster, a table will pop out showing the gene expression of top genes in that cluster.
iDREM
iDREM stands for interactive visualization of dynamic regulatory networks. Under this mode, when you click a cluster with a complete track, you will be directed to a new iDREM page that shows the gene expression patterns. If the cluster you clicked doesn’t have a complete track, a notification will pop up.
Highlight on Umap
Under this mode, when you click a cluster on the 2D lineage plot, that cluster will be highlighted in the umap on the right.