Tutorial - Basic Analysis Pipeline
This is a step by step demonstration of the basic user flow of finding a drug with a high perturbation score.
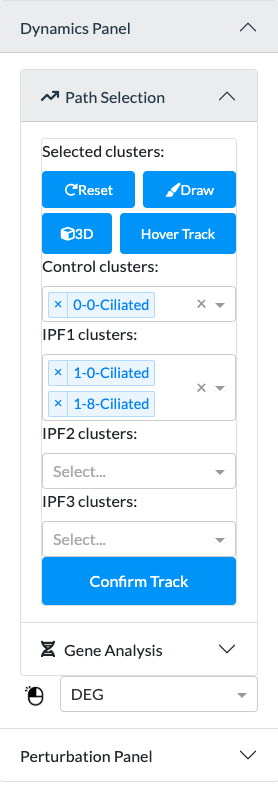
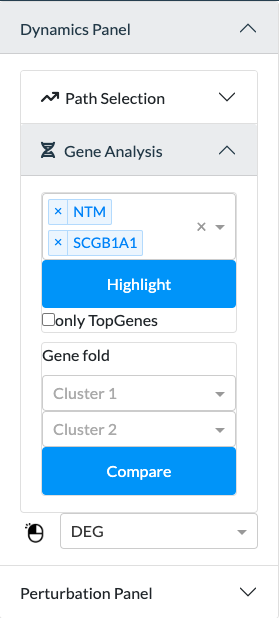
First you need to select a track in the path selection panel and genes in the gene analysis panel.
Different plots will be drawn in the tabs based on your selection. Details can be found in tutorial 2 and tutorial 3.
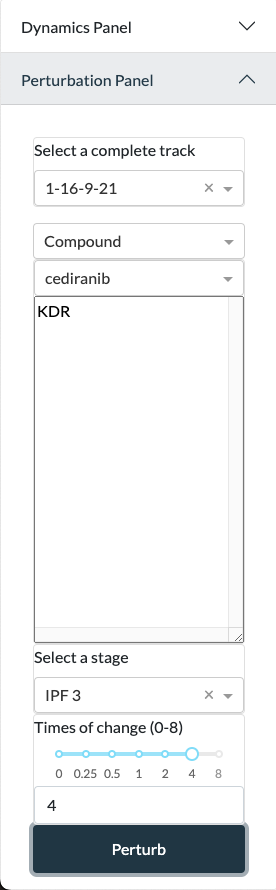
Now we can go to the perturbation panel. We need to select a track, a compound, the stage, and the times of change. After all selections are made, click “Perturb” button to start the calculation.
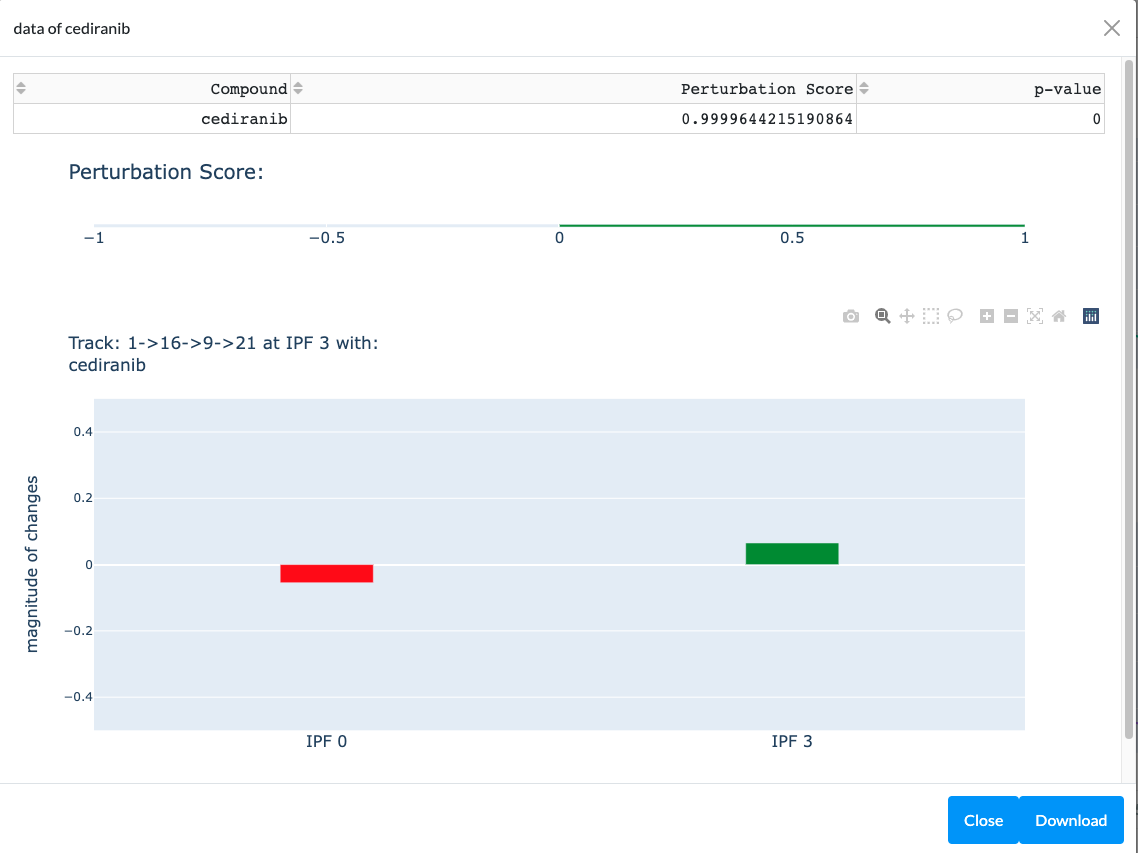
The calculation will finish in a few seconds. A table will pop out with the perturbation information including perturbation score, p-value, and the difference of the magnitude of changes between stage 0 and the selected stage.