Tutorial - Explore Graph Tab
In this tutorial, we will show you how to navigate the graph tab.
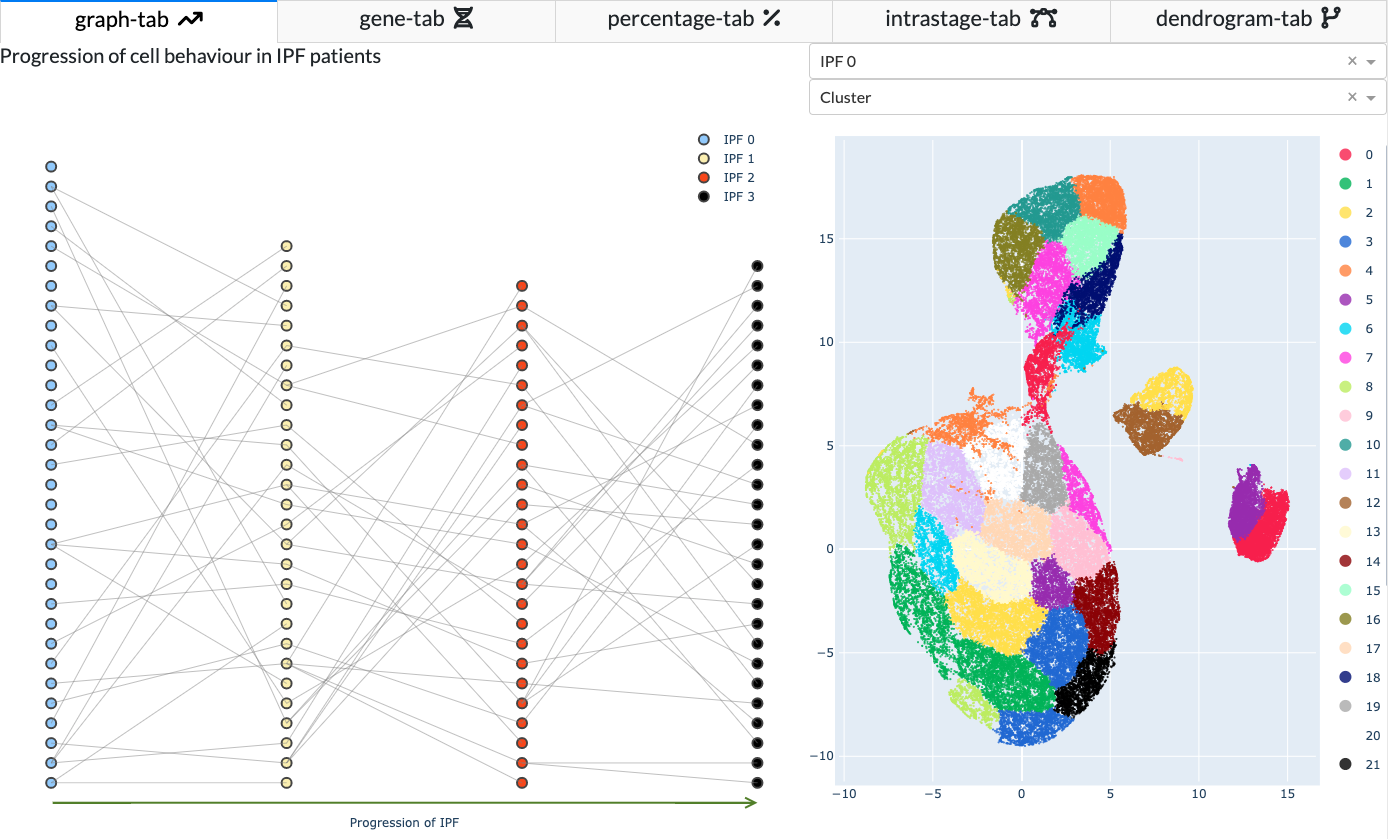
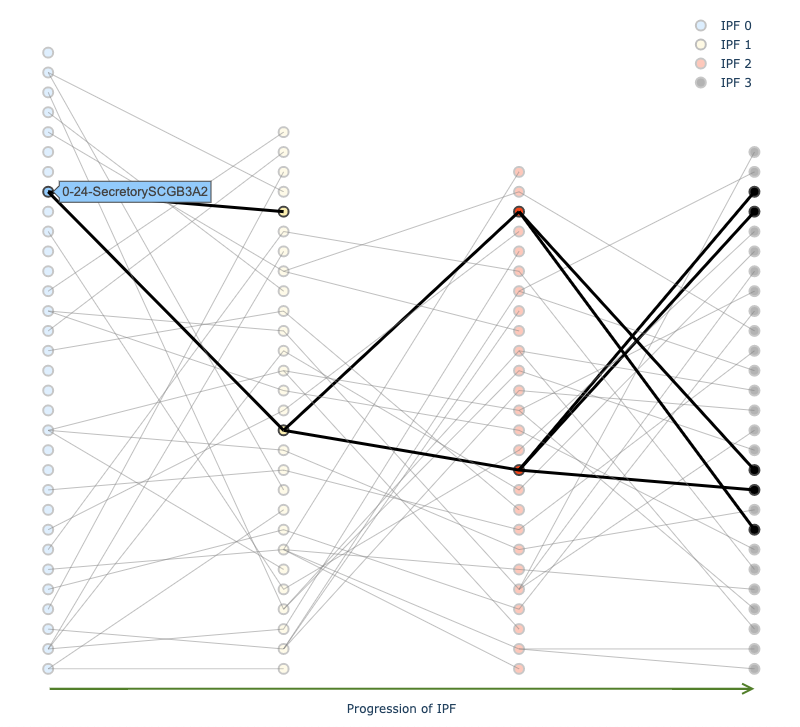
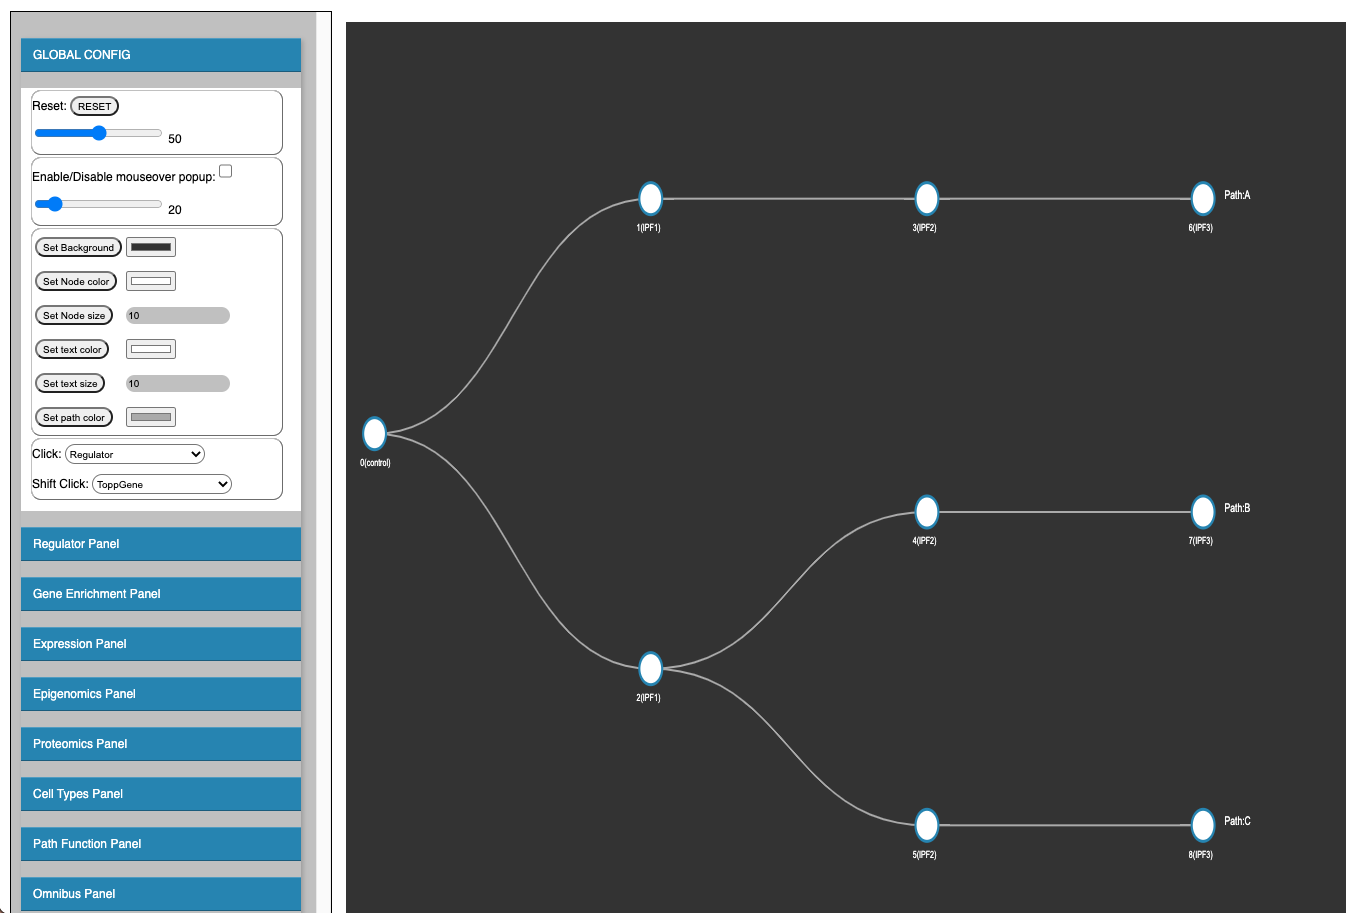
Lineage Plot
On the left of graph tab is the lineage plot. When you hover over a cluster, the tracks in which it belongs to will be highlighted. You can disable the hover track feature by clicking the ‘Hover Track’ button in the path selection panel in the sidebar.
You can also use the sidebar to draw specific tracks. Please navigate to the Path Selection panel under Dynamics Panel. You can select the clusters you want to investigate using the dropdown menus. Once you select a control cluster, the clusters in IPF 1, 2, 3 will be automatically filled in.
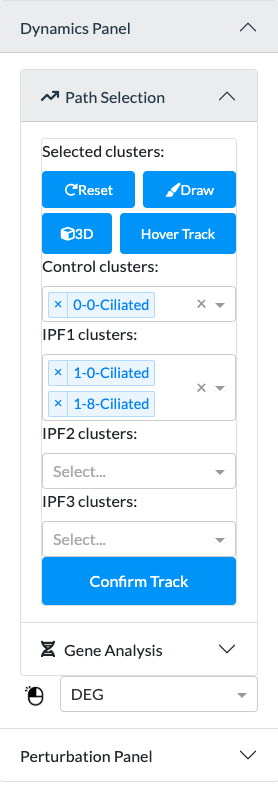
After you finish selecting, click ‘Confirm Track’.
Now you can click the ‘Draw’ button to highlight the selected clusters.
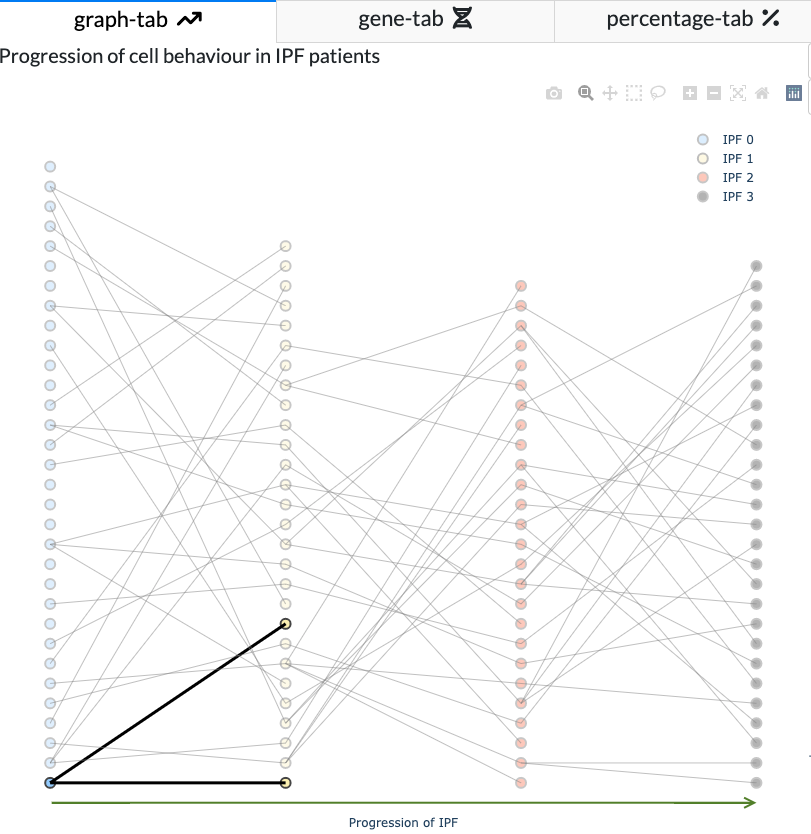
You can use the ‘Reset’ button to clear your selection.
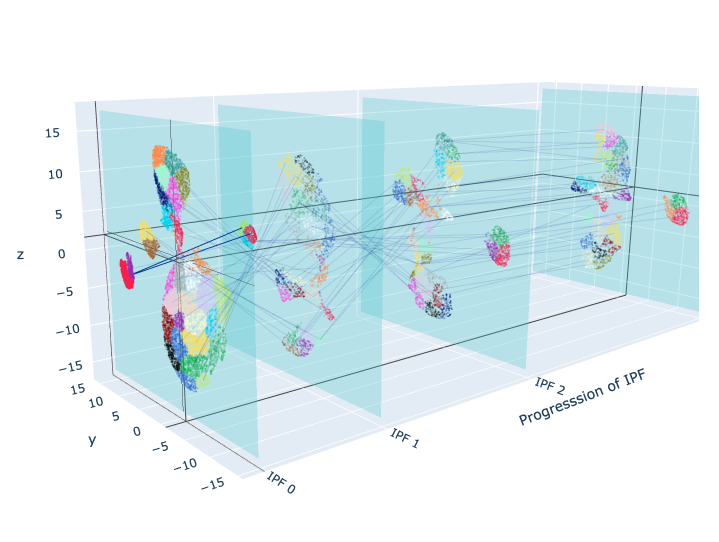
3D Lineage Plot
You can click the ‘3D’ button to view the lineage plot in 3D to have a better view on how the maps of each IPF stage are connected. The selected track will be highlighted. You can click again to return to the 2D lineage plot.
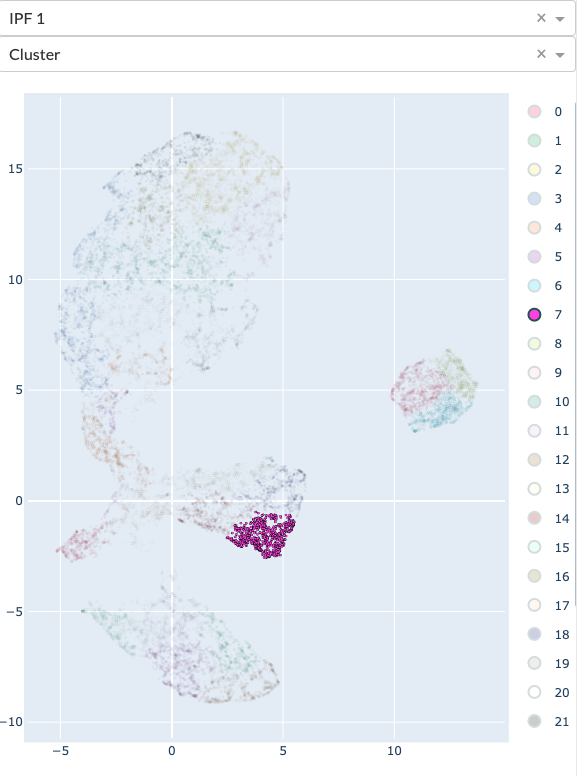
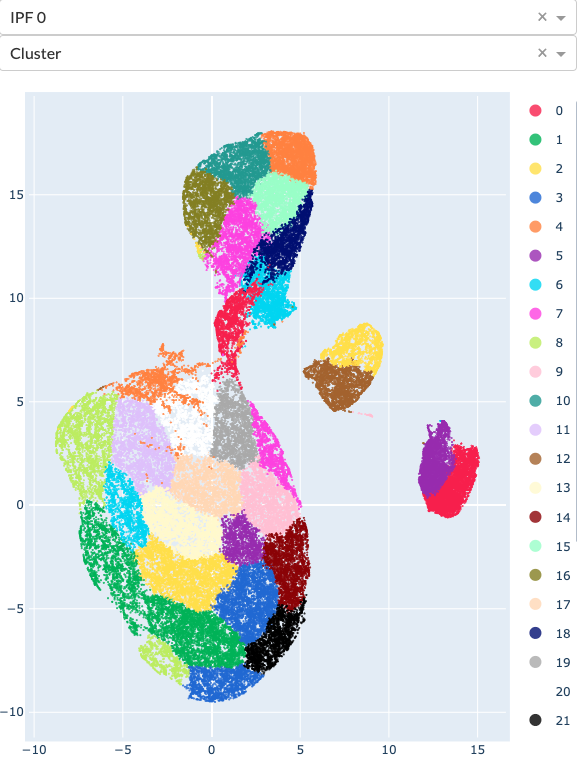
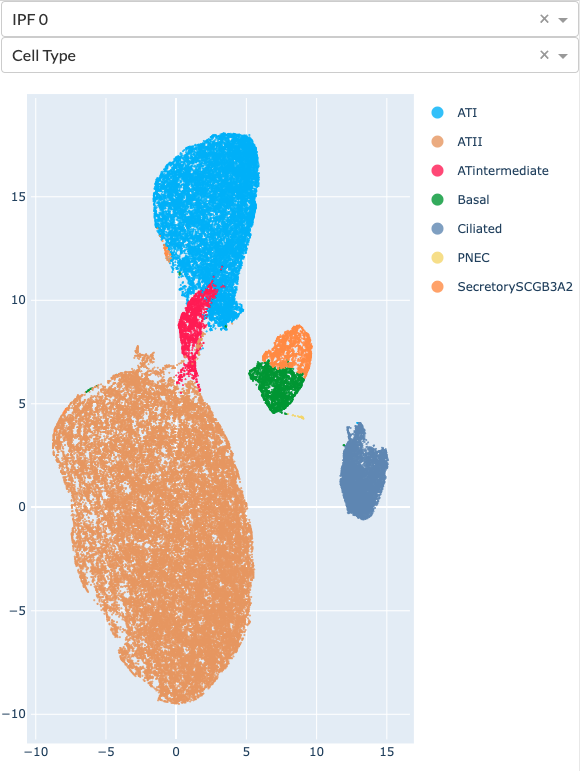
Umaps
On the right of graph tab is the umap section. You can use the two dropdown menus to choose which umap you would like to display.
Display Mode
There are three display mode: DEG, iDREM, and Highlight on Umap. We will explain each in details below.
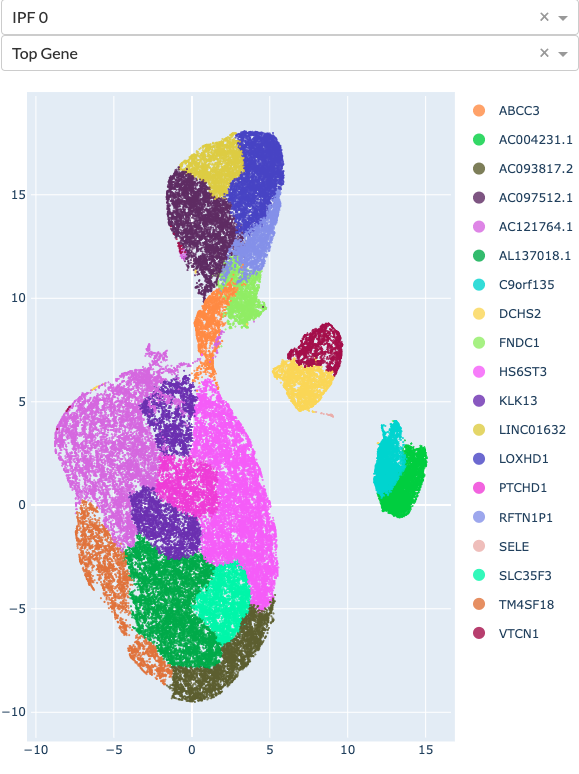
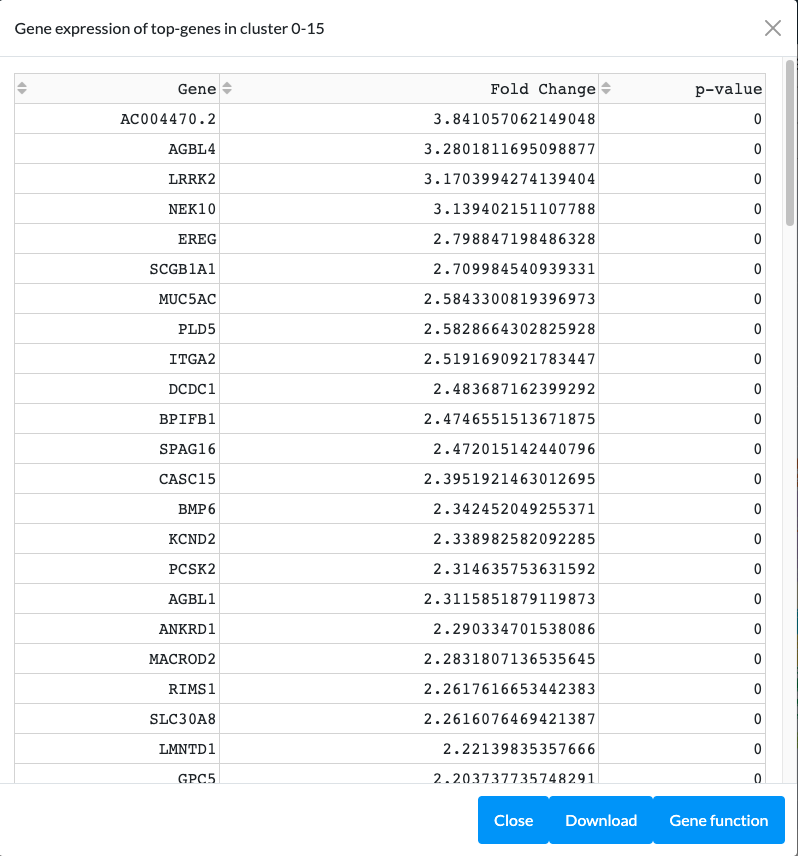
DEG
The default display mode is DEG. Under DEG mode, when you click a cluster, a table will pop out showing the gene expression of top genes in that cluster.
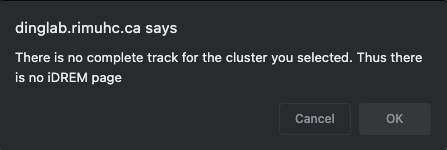
iDREM
Under this mode, when you click a cluster with a complete track, you will be directed to a new iDREM page. If the cluster you clicked doesn’t have a complete track, a notification will pop up.
Highlight on Umap
Under this mode, when you click a cluster, that cluster will be highlighted in the umap.